
Tables and tabs
Order management linked to table and tab service.
Connect table service to order preparation, ingredient consumption and the restaurant’s financial control.
Order management linked to table and tab service.
Separate print routing for the kitchen and the cashier.
Ingredient control with stock deduction driven by recipe sheets.
Cost of goods sold calculation and blind cash count at closing.
Separate profiles for kitchen, service, cashier, supervision and management, with areas limited by role.
Results presented as delivered capabilities. There are no published quantitative indicators or testimonials for this project yet.
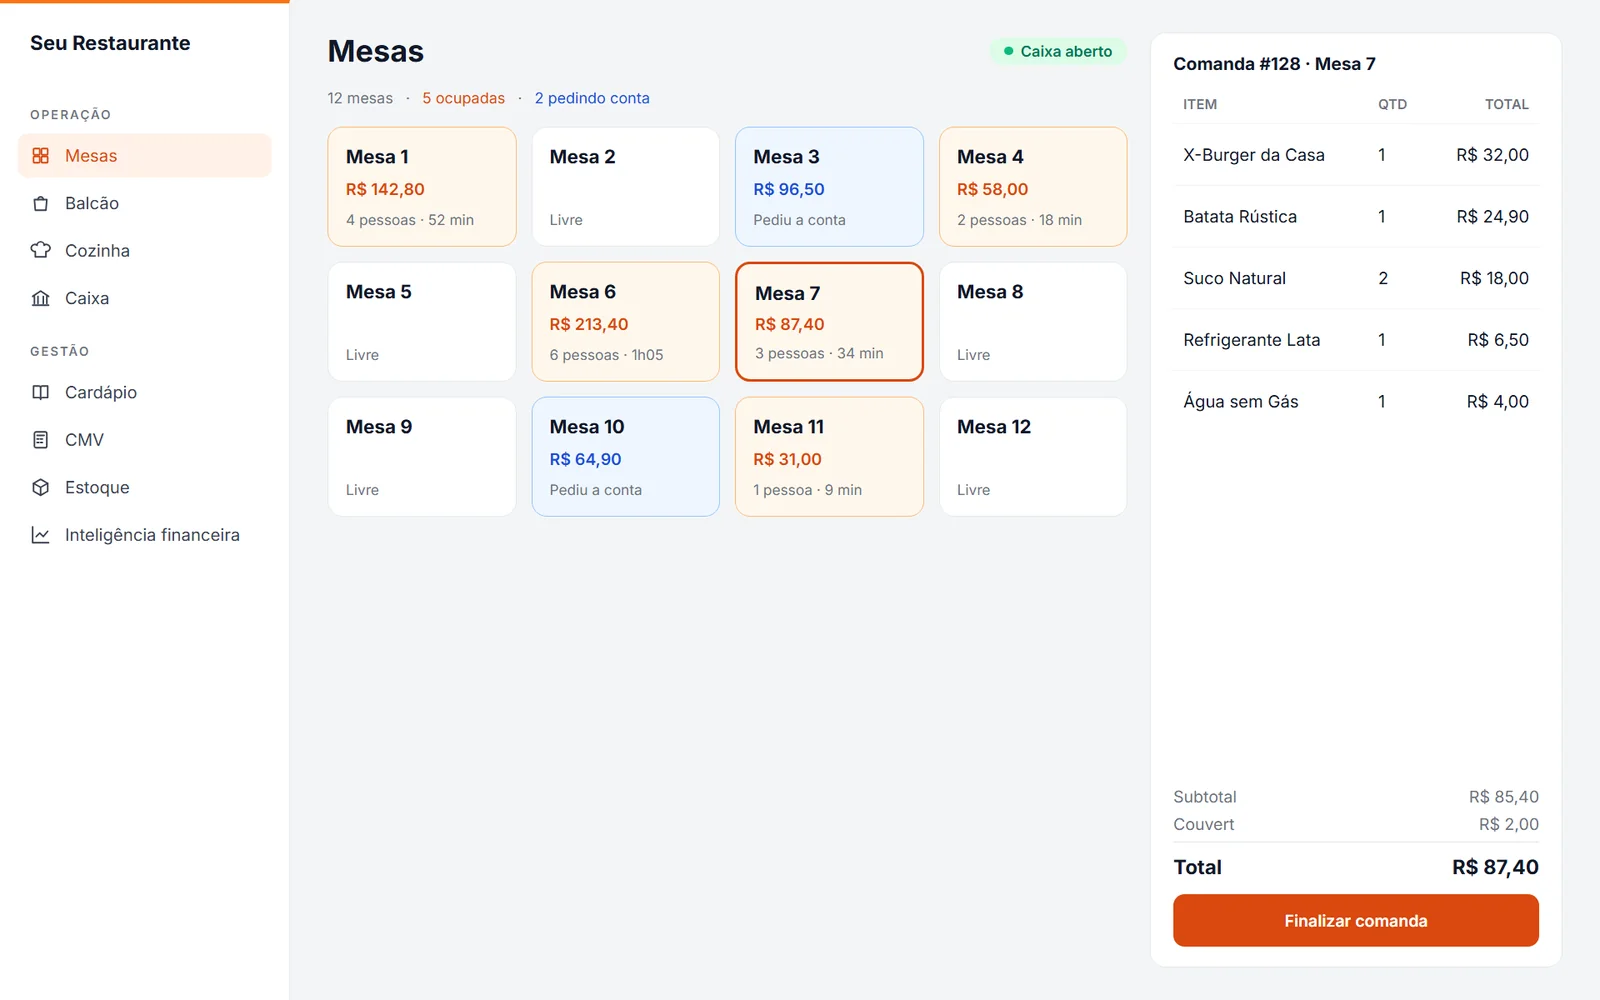
Table map with occupancy status and an open tab alongside
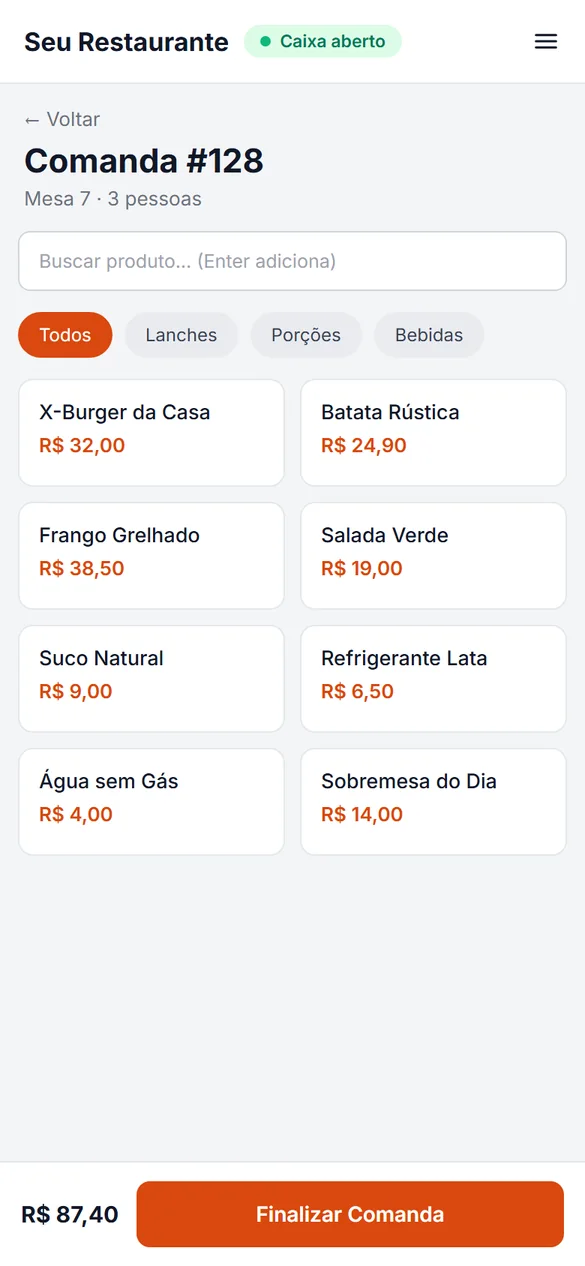
Open tab with product search by category and total to close
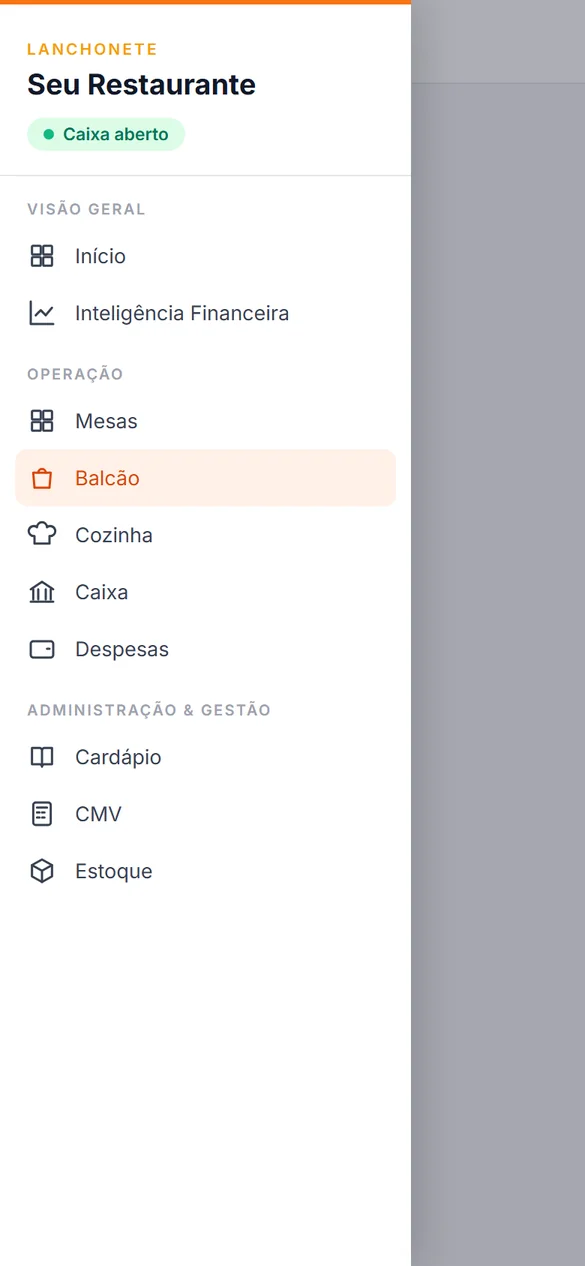
System menu with tables, counter, kitchen, cashier, menu, COGS and inventory
Screens recreated with fictitious data to protect client information.
What the kitchen sees doesn’t have to be what the cashier or management sees.
Production has a dedicated profile, with access limited by role.
Illustrative representation of the documented profiles; this is not a session in the client’s system.
Being prepared
In our food service projects, COGS connects costs, supplies and management. What does that look like in your numbers?
Use values from the same period. The starting numbers are only an example, not client data.
COGS = opening inventory + purchases − closing inventory
This balance is not profit: salaries, rent, taxes and other expenses still apply. There is no single ideal percentage for every business.
I want to understand my costsIllustrative period COGS simulation; it does not reproduce the recipe- or flavor-based calculation used in the projects. Values are not saved or sent while you type. When you open WhatsApp, only the result goes with your message.